Imaging with a vector-Apodizing Phase Plate coronagraph
We will introduce the propagation of polarized light through a vector apodizing phase plate coronagraph (vAPP).
We’ll start by importing all relevant libraries and setting up our pupil and focal grids. We also import precomputed phase file for the pupil and the vAPP and the pupil the vAPP pattern was calculated for.
from hcipy import *
import numpy as np
import matplotlib as mpl
import matplotlib.pyplot as plt
import os

# For notebook animations
from matplotlib import animation
from IPython.display import HTML
pupil_grid = make_pupil_grid(512)
focal_grid = make_focal_grid(4, 40)

prop = FraunhoferPropagator(pupil_grid, focal_grid)

vAPP_phase = Field(read_fits('vAPP_phase.fits.gz').ravel(), pupil_grid)
telescope_pupil = Field(read_fits('vAPP_amplitude.fits.gz').ravel(), pupil_grid)
A vector apodizing phase plate can be modelled as a half-wave retarder with a varying fast-axis orientation [1] [2]. A vAPP applies geometric phase to the incoming wavefront. The applied geometric phase, \(\delta (x, y)\), only depends on the fast-axis orientation, \(\Phi (x, y)\), through:
The sign of the acquired phase depends on the input circular polarization state. To simulate a vAPP, we define it as a phase retarder with a fast-axis orientation that is the phase / 2 and a retardation of \(\pi\).
We plot the phase pattern and the fast-axis orientation pattern.
[1] Snik, Frans, et al. “The vector-APP: a broadband apodizing phase plate that yields complementary PSFs.” Proc. SPIE, Vol. 8450 (2012)
[2] Otten, Gilles PPL, et al. “Performance characterization of a broadband vector Apodizing Phase Plate coronagraph.” Optics Express 22.24 (2014)
def quiver_plot_retarder(fast_axis_orientation, N):
    '''Plot the fast-axis orientation of a retarder

    Parameters
    ---------
    fast_axis_orientation : Field
        The input fast_axis_orientation that is plotted
    N : Scalar
        A scalar that determines the sampling of fast_axis_orientation that is plotted
    '''
    pupil_grid = fast_axis_orientation.grid
    X = pupil_grid.x.reshape(pupil_grid.shape)[::N,::N]
    Y = pupil_grid.y.reshape(pupil_grid.shape)[::N,::N]
    U = np.cos(fast_axis_orientation.shaped[::N,::N])
    V = np.sin(fast_axis_orientation.shaped[::N,::N])
    quiveropts = dict(color='black', headlength=0, pivot='middle', scale=30, units='xy', width=.003, headwidth=0)
    plt.quiver(X,Y,U,V,**quiveropts )
# Defining the properties of the vAPP
fast_axis_orientation = vAPP_phase / 2
phase_retardation = np.pi
circularity = 0

# Making the vAPP
vAPP_pol = PhaseRetarder(phase_retardation, fast_axis_orientation, circularity)

# Setting up the sampling of the quiver plot
N = 16

# Plotting the phase pattern and fast-axis orientation pattern
plt.figure()

plt.subplot(1,2,1)
imshow_field(fast_axis_orientation, mask=telescope_pupil, cmap='RdBu')

plt.subplot(1,2,2)
imshow_field(telescope_pupil, cmap='gray')
quiver_plot_retarder(fast_axis_orientation, N)

plt.gca().set_aspect('equal')
plt.show()
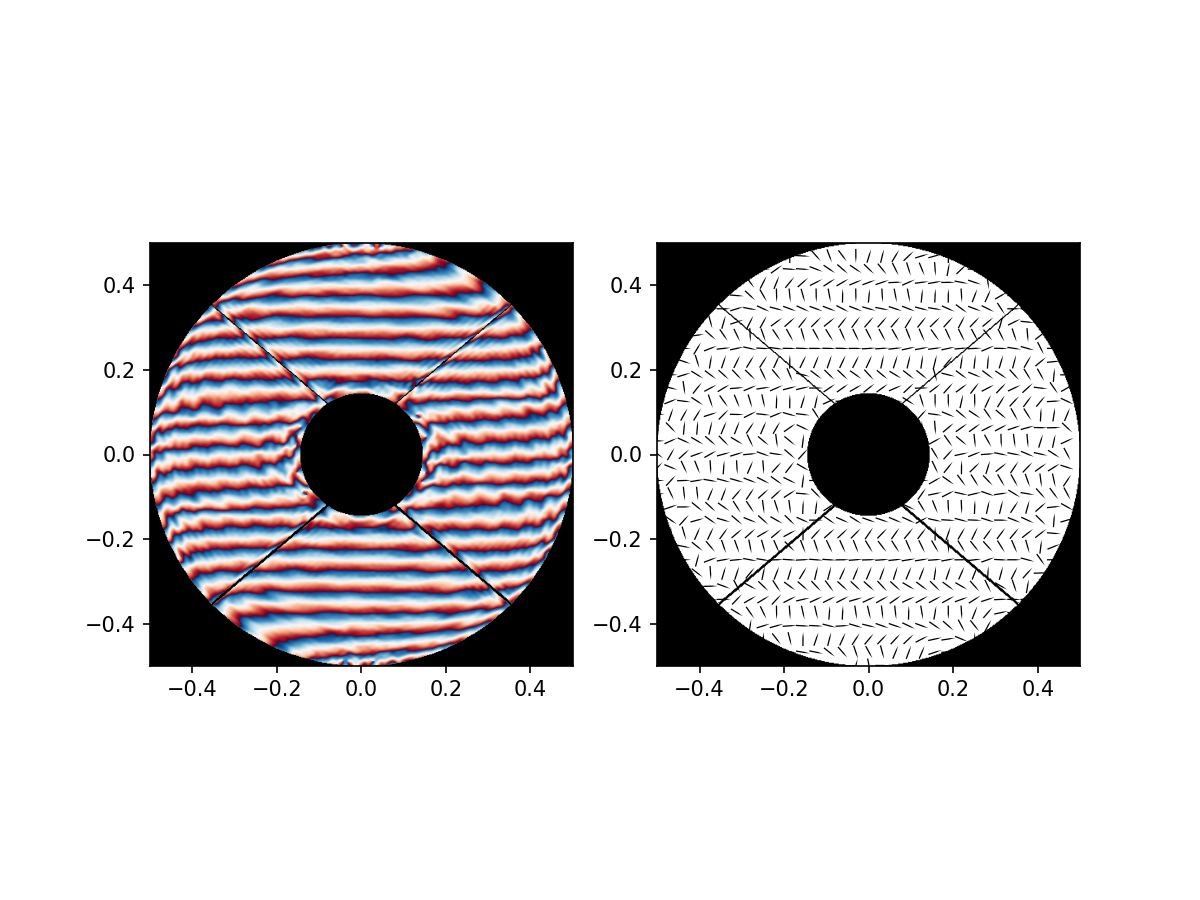
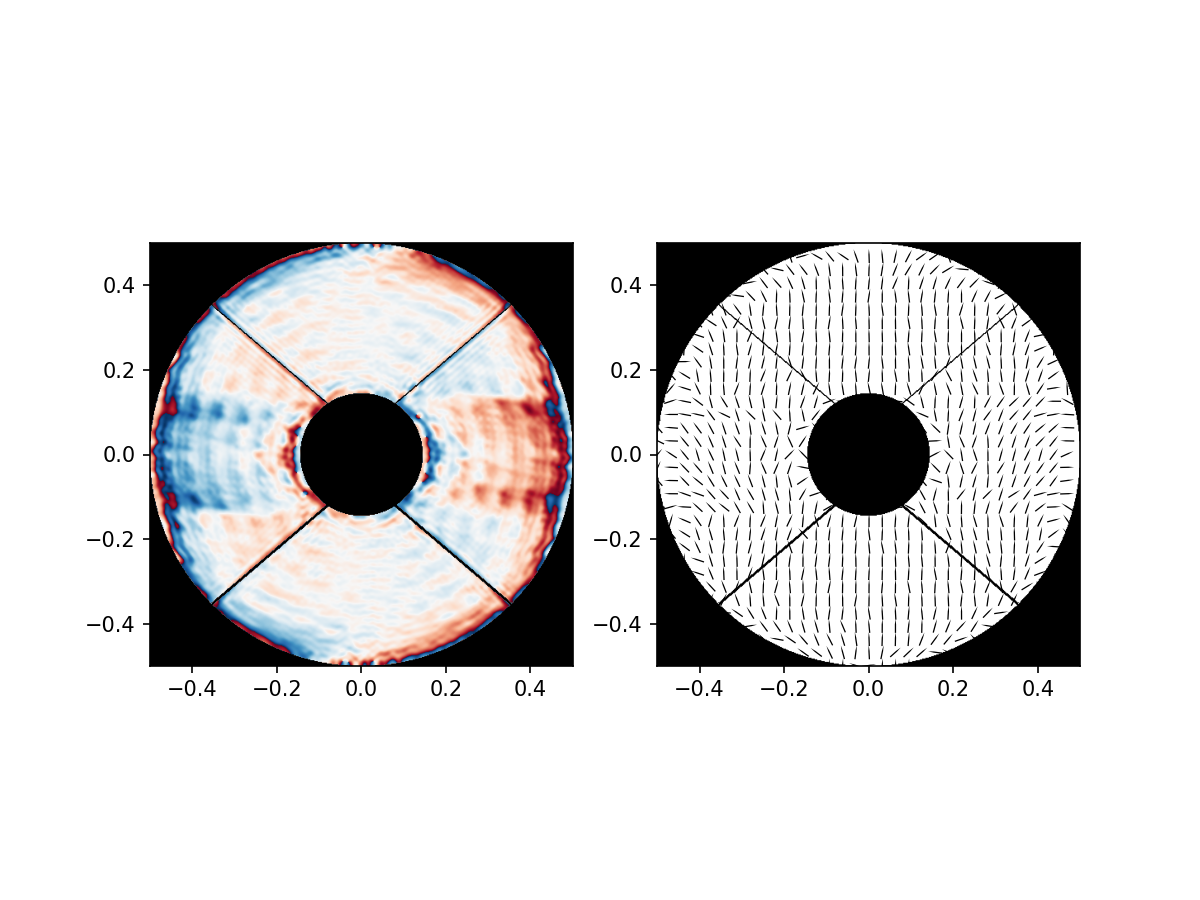
The vAPP phase pattern has a phase ramp ( = polarization grating) to separate the two circular polarization states when imaged on a detector. The sampling of the fast-axis orientation is not good enough to fully capture the phase pattern. Therefore, we subtract the grating pattern from the phase pattern.
# Removing the grating pattern
fast_axis_orientation_new = (vAPP_phase - pupil_grid.y * 20 * 2 * np.pi) / 2

# Changing the values to make the pattern aesthetically pleasing
fast_axis_orientation_new = (fast_axis_orientation_new - np.pi / 2) % np.pi

# Setting up the sampling of the quiver plot
N = 16

# Plotting the phase pattern and fast-axis orientation pattern
plt.figure()

plt.subplot(1,2,1)
imshow_field(fast_axis_orientation_new, mask=telescope_pupil, cmap='RdBu')

plt.subplot(1,2,2)
imshow_field(telescope_pupil, cmap='gray')
quiver_plot_retarder(fast_axis_orientation_new, N)

plt.gca().set_aspect('equal')
plt.show()
We simulate the vAPP by propagating a left-circularly polarized wavefront through the vAPP. The intensity image is simulated by propagating to the focal plane.
wavefront = Wavefront(telescope_pupil, 1, input_stokes_vector=(1, 0, 0, -1))
wavefront_out = vAPP_pol.forward(wavefront)

vAPP_PSF = prop(wavefront_out).intensity

imshow_field(np.log10(vAPP_PSF / vAPP_PSF.max()), vmin=-5)
plt.show()
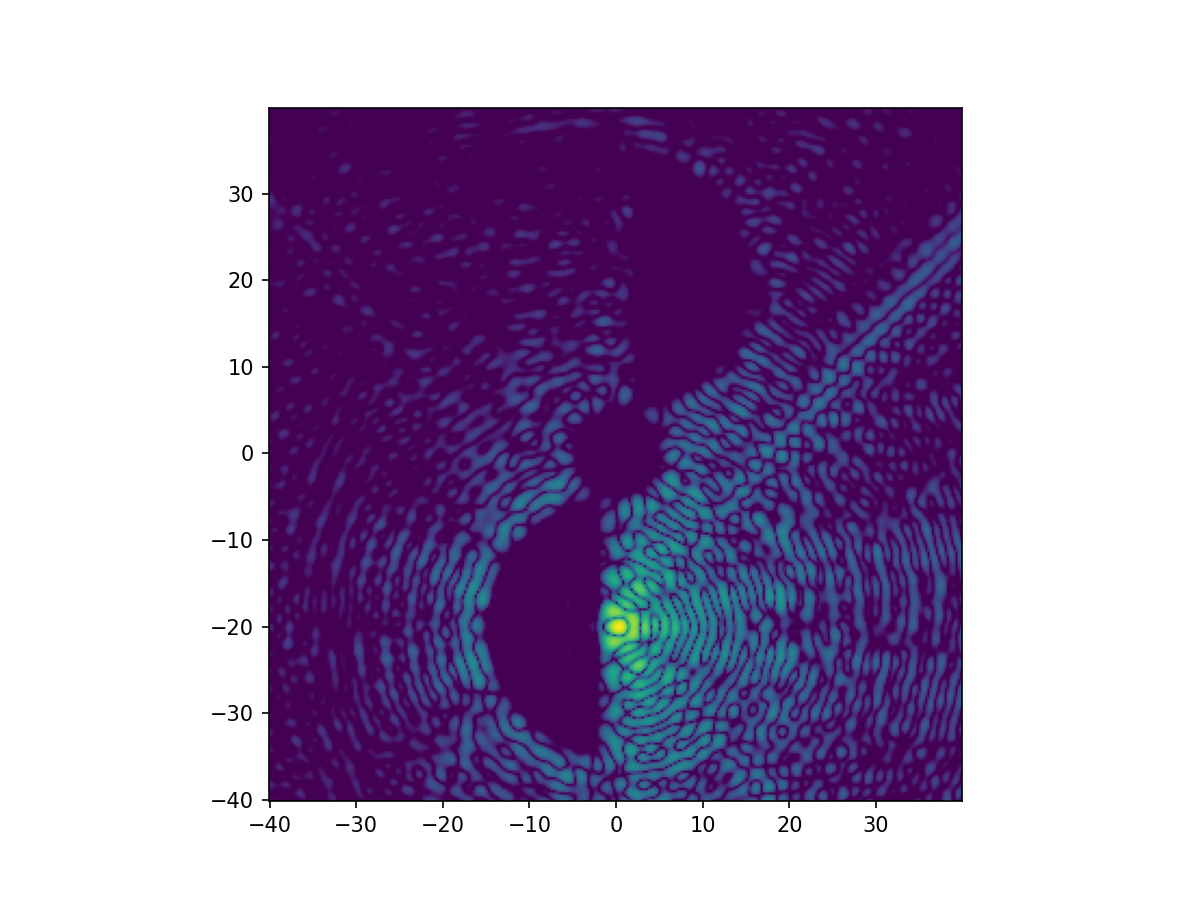
The vAPP PSF has a dark zone from 2-15 \(\lambda/D\) and the coronagraphic PSF is offset from the center because of the grating that is added to the phase. For the right-circular polarization state, the applied phase is opposite, and the PSF is different.
wavefront = Wavefront(telescope_pupil, 1, input_stokes_vector=(1, 0, 0, 1))
wavefront_out = vAPP_pol.forward(wavefront)

vAPP_PSF = prop(wavefront_out).I

imshow_field(np.log10(vAPP_PSF / vAPP_PSF.max()), vmin = -5)
plt.show()

To simulate the observation of a star, we use unpolarized light. Unpolarized light contains equal amount of left-circular polarization and right-circular polarization. Therefore, the stellar PSF is a combination of the two previously simulated PSFs.
wavefront = Wavefront(telescope_pupil, 1, input_stokes_vector=(1, 0, 0, 0))
wavefront_out = vAPP_pol.forward(wavefront)

vAPP_PSF = (prop(wavefront_out).I)

imshow_field(np.log10(vAPP_PSF / vAPP_PSF.max()), vmin = -5)
plt.show()
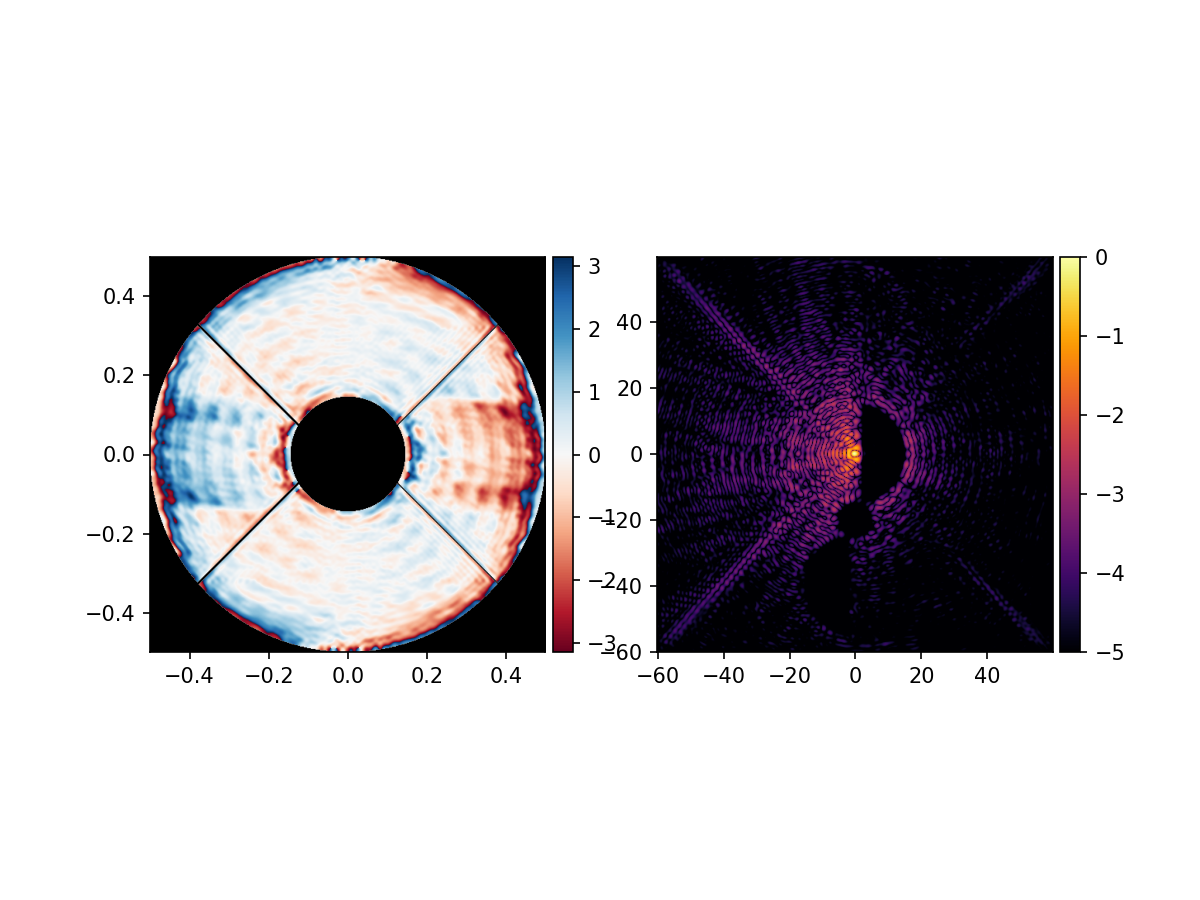
In an ideal case is the vAPP described by a patterned half-wave retarder. However, the retardation is not always half wave. This does not change the coronagraphic PSF, but rather changes the amount of light that is diffracted as the coronagraphic PSFs. The fraction that is not diffracted is called polarization leakage and is imaged in the center of the detector. Here we simulate the image plane of a vAPP for different retardations.
retardation = np.linspace(0, 2 * np.pi, 37, endpoint=True)
wavefront = Wavefront(telescope_pupil, 1, input_stokes_vector=(1, 0, 0, 0))
vAPP_pol = PhaseRetarder(retardation[0], fast_axis_orientation, circularity)

fig = plt.figure()
im = imshow_field(focal_grid.x, focal_grid, vmin=-5, vmax=0)
title = plt.title('', fontsize='xx-large')
plt.close()


def animate(i):
    vAPP_pol.phase_retardation = retardation[i]
    wavefront_out = vAPP_pol.forward(wavefront)

    vAPP_PSF = Field((prop(wavefront_out).I),focal_grid)
    vAPP_PSF /= vAPP_PSF.max()

    x, y = focal_grid.coords.separated_coords
    im.set_data(np.log10(vAPP_PSF.shaped))
    title.set_text('Retardance = {0} degrees'.format(round(np.degrees(retardation[i]),0)))
    return im, title

ani = animation.FuncAnimation(fig, animate, range(len(retardation)), blit=True)
HTML(ani.to_html5_video())
The vAPP applies gemeometric phase that is inherently independent of wavelength. The shape of the coronagraphic PSFs does not change as function of wavelength, except for wavelength scaling. In addition, the retardance changes as wavelength, causing the intensity of the polarization leakage to change accordingly.
wavelengths = np.linspace(0.9, 1.1, 21)

retardation = lambda wavelength: np.pi / wavelength

fig = plt.figure()
im = imshow_field(focal_grid.x, focal_grid, vmin=-5, vmax=0)
title = plt.title('',fontsize = 'xx-large')
plt.close()

vAPP_pol = PhaseRetarder(retardation, fast_axis_orientation, circularity)

def animate(i):
    wavefront = Wavefront(telescope_pupil, wavelength=wavelengths[i], input_stokes_vector=(1, 0, 0, 0))
    wavefront_out = vAPP_pol.forward(wavefront)

    vAPP_PSF = Field((prop(wavefront_out).I),focal_grid)
    vAPP_PSF /= vAPP_PSF.max()

    x, y = focal_grid.coords.separated_coords
    im.set_data(np.log10(vAPP_PSF.shaped))
    title.set_text('Normalized wavelength = %.2f' % wavelengths[i])
    return im, title

ani = animation.FuncAnimation(fig, animate, range(len(wavelengths)), blit=True)
HTML(ani.to_html5_video())